Reporting and analytics that show what’s actually driving firm performance.
Bring together revenue, capacity, realization, WIP, collections, and profitability across your firm, then use Qount MCP to connect your data to AI tools and explore what’s behind the numbers.
Reports show performance. Partners need to understand what’s driving it.
Revenue is up, realization is down, and three partners have three explanations. Qount connects what a client paid with the time and staff cost of delivering the work, the progress of that work and the cash it turned into, across every client, workflow, department and partner. Then it lets you ask why, in plain English, and follow the answer to the engagement, the person or the period behind it.
Qount Advantage AI
Ask the question behind the number
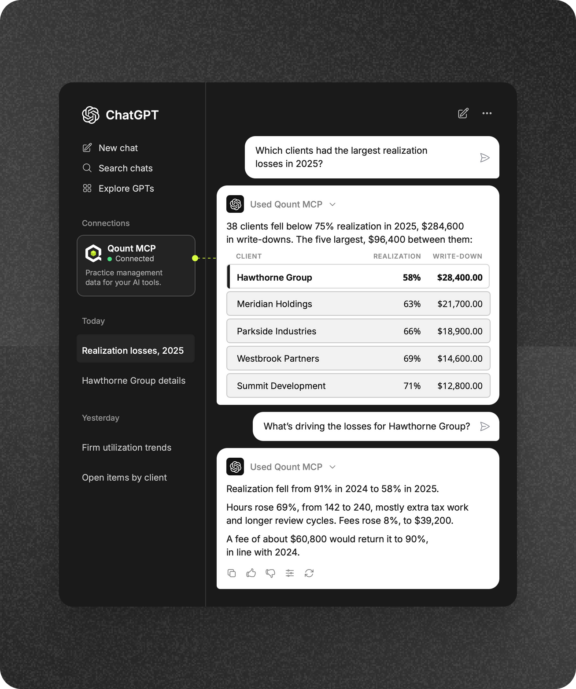
Realization dropped four points. A dashboard tells you that. Qount lets you ask why. Ask in plain English, get an answer from your firm’s own data, then narrow it to a department, a client or a period until you have the reason, without building a report first. It runs in the AI your firm already uses, ChatGPT, Claude, Gemini, Microsoft Copilot or another MCP tool connector, connected through Qount MCP.
- Start with the business question. Which clients are underpriced? Where is capacity going? Why did collections slow? Ask it the way you would ask your controller, and the answer comes from your Qount data.
- Follow the answer down. Go from the firm total to the department, the workflow, the client, and the period behind it in the same conversation, without opening a second report.
- Keep every route open. Native reports and dashboards for the daily view. Qount MCP for the question that comes up in a partner meeting. The Data Lake and APIs for your BI team.
- Stay in control of who asks what. Firm admins decide who can connect and which reports they can reach. Access follows each user’s Qount permissions, and client identifiers such as SSNs and EINs never leave Qount.
How this is different: Most reporting ends where the dashboard does. In Qount the conversation continues: ask why realization fell and get the clients, workflows and people behind it, without building a report first.
Qount Advantage
Know what every engagement actually earns
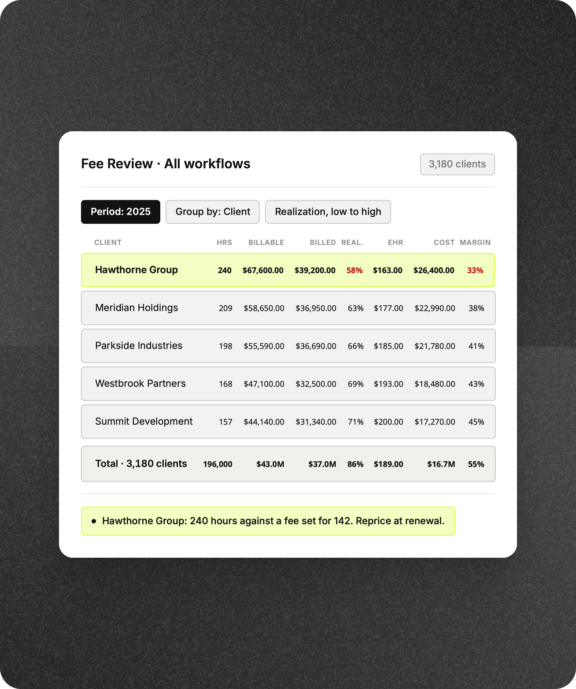
A fee is not a margin. Qount sets what a client paid against the hours, the billing rates and the staff cost of delivering the work, by the body of work that matters: a tax year, a monthly close, an audit. Realization, effective hourly rate (EHR), write-ups and write-downs, and delivery margin sit together in the fee review, so pricing decisions start from the economics rather than the invoice.
- Measure the work, not the invoice month. Review a workflow period, TY2025 1040s or April’s monthly accounting, across every client receiving that service, so the comparison is like for like.
- Set fees against the effort behind them. Hours, billable value at standard rates, the amount actually billed, and staff cost, side by side for each client and workflow.
- Find the engagements that quietly lost money. Realization, EHR, and margin flag the clients whose fee stopped covering the work before next year’s engagement letter goes out.
- Walk into the fee review with the numbers. Compare client and workflow economics, then decide: reprice, rescope, or change how the work is delivered.
How this is different: Margin by invoice month tells you about April. Qount measures the work itself: a tax year or a monthly close, across every client receiving that service, with staff cost counted.
Qount Advantage
Give every partner their portfolio, and every service line its margin
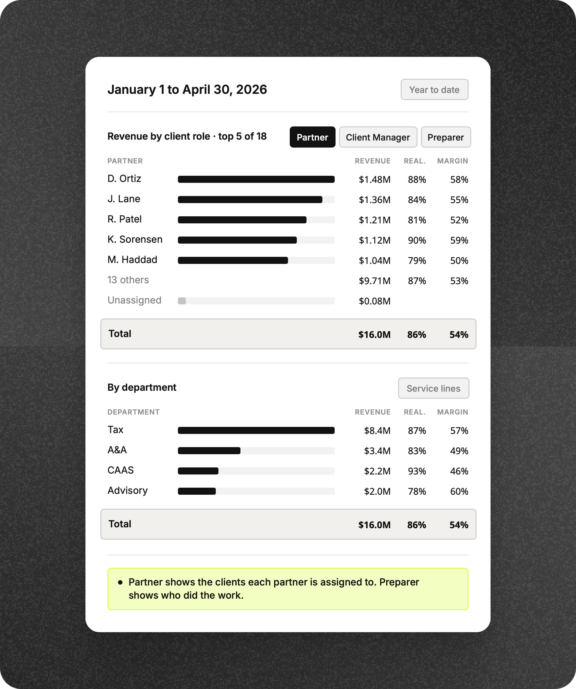
Qount breaks revenue, collections, realization, EHR, and margin out by client role, department, workflow, and portfolio, so leadership can see which parts of the firm are carrying performance and which need attention.
- Review the portfolio each partner oversees. Revenue, collections, production, and margin for the clients assigned to a partner, a manager, or any client role your firm defines.
- Compare service lines on their economics. Realization, AHR, and margin by department, Tax, CAAS, Advisory, A&A, then the workflows and clients underneath.
- Separate the portfolio from the production. A partner’s book and the staff who logged the hours are different questions. Qount answers each on its own.
- Put incentives on numbers everyone can see. Staff incentive reports by production, by collections, or by completed workflow status support the firm’s own review process.
How this is different: A partner’s portfolio and the staff who did the work are different questions. Qount answers each on its own, so partner reviews stay on the economics, not on whose hours they were.
See where margin is leaking: effort, backlog or cash
Margin rarely disappears in one place. It leaks through hours that run past budget, work that stalls short of done, WIP that ages unbilled and invoices that wait for cash. The Firm Intelligence Dashboard puts utilization, work progress, WIP, revenue, collections and receivables on one screen, so leadership knows where to look first.
Keep the firm’s health in view. Revenue, collections, receivables, WIP, realization, utilization, and completion on one dashboard, with the trend beside each number.
See where the hours are going. Billable and non-billable time, utilization by person and department, and budget versus actual on the work that is running over.
Follow the work to done. Completion, backlog, and on-time delivery by workflow and period, next to the revenue the completed work produced.
Bill what is waiting and collect what is billed. WIP aging, outstanding invoices, collections, and receivables aging, so nothing sits unbilled or unpaid longer than it should.
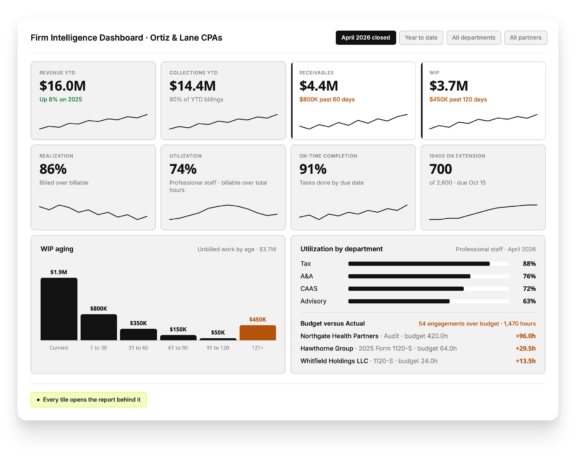
How this is different: Utilization, backlog, WIP and receivables usually live in four reports read by four people. Qount puts them on one screen, so the partner meeting starts from the same numbers.
One set of numbers. Three ways in.
Qount gives your firm three ways to work with the same underlying data: in native reports, through AI, or in your BI environment.
In Qount
Reports and dashboards
Firm Intelligence DashboardFirm metricsFilters and drill-downsExports
For the people who run the firm every day.
✦Through AI
Qount MCP
ChatGPTClaudeAny MCP-compatible assistant
Your Qount permissions apply, with admins choosing who connects and which reports they reach.
In your BI
Data Lake and APIs
Data LakeAPIsPower BI, Tableau or LookerYour other systems
For your analytics team, when the question needs more than a report.
Reporting and analytics for every layer of the firm
Dashboards, firm metrics, revenue, production, time, billing and AI access all read from the same Qount data, so every layer of the firm works from the same numbers.
-
-
Realization, margin and fee review
-
Revenue and workflow-period analysis
-
Production reporting
-
WIP aging and trends
-
Collections and receivables
-
Time and utilization
-
Workflow progress and budgets
-
Staff incentive reporting
-
Conversational analysis through MCP
-
Data Lake, BI and API access
-
Filters, drill-downs and exports
Practice management that brings profitability into focus
See how accounting firms use Qount to understand performance, uncover opportunities, and make better decisions with their data.







One Platform. Total Visibility.
Get a Demo of Qount Practice Management
Whether you are replacing legacy practice management software or consolidating multiple tools into one system, Qount provides the structure and intelligence modern firms require.